
Engineering Metrics Automation
Deployment frequency dropped 30%. You don't know why and don't have the day to find out.
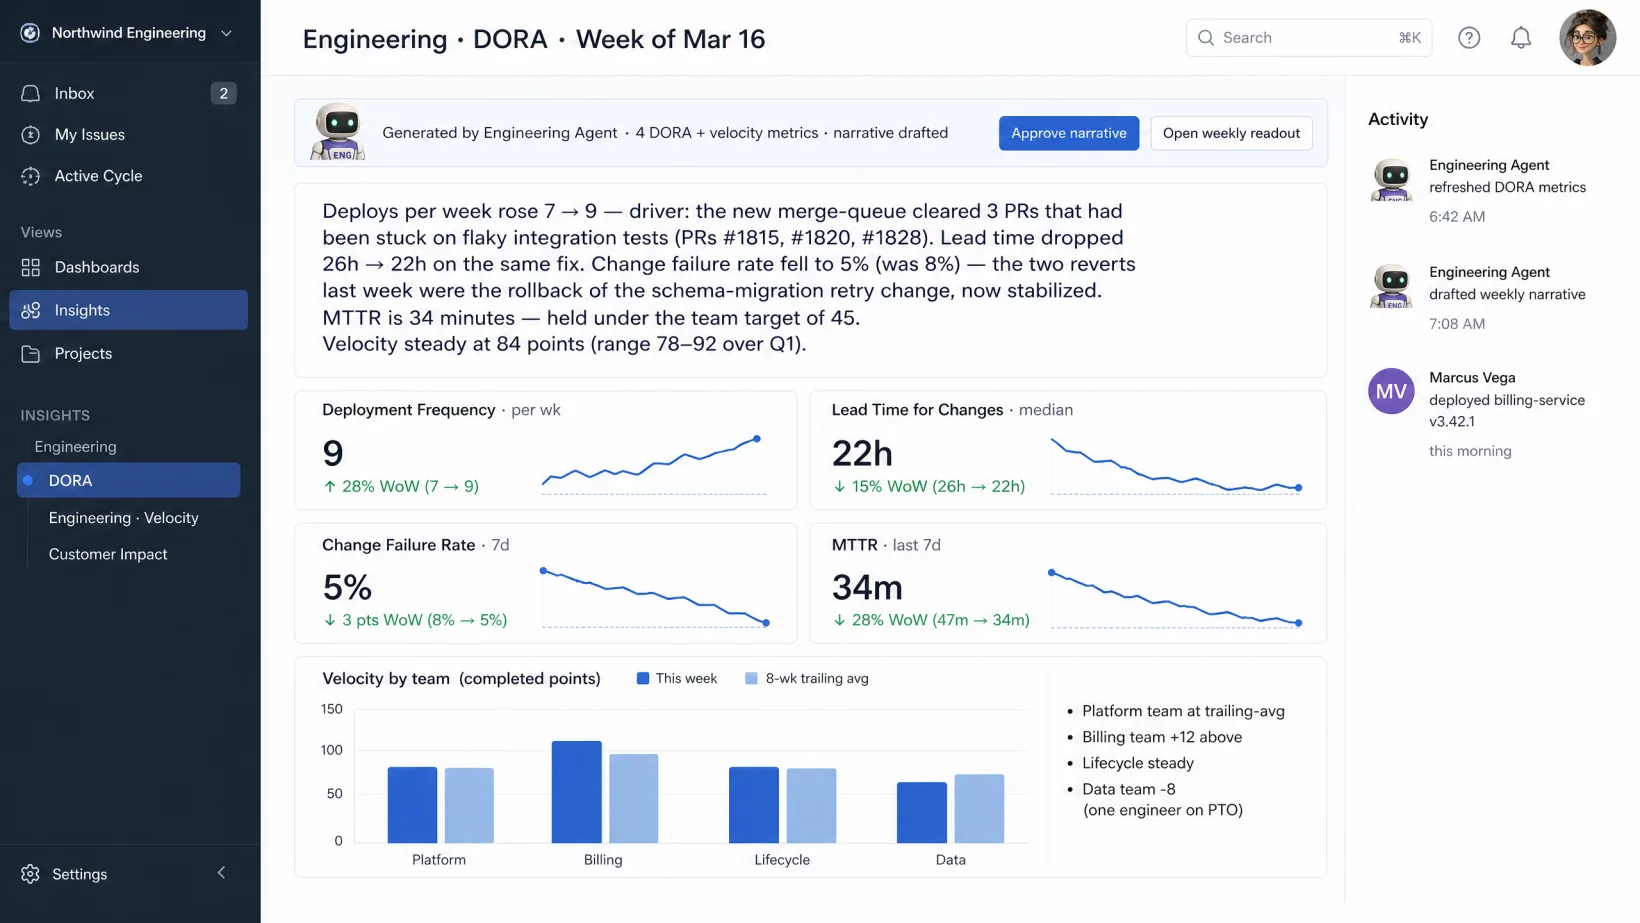
Engineering metrics dashboard that pulls DORA metrics (deployment frequency, lead time, change failure rate, mean time to recovery), velocity, and deploy frequency from your tools, drafts the weekly narrative on what moved, and holds it for you to review. The leadership readout writes itself; you decide what surfaces.
~4 hrs/wk back to you · DORA + velocity metrics explained, not just charted
HOW IT WORKS
Three steps per week.
Managed service. We do the setup, the agent orchestration, the exception handling. You own the decisions.
Step 1
Agents pull every engineering metric overnight.
From GitHub, your continuous integration and deployment (CI/CD) pipelines, your project tracker, your incident tooling. Deploy frequency, lead time, change failure rate, mean time to recovery (MTTR), velocity, capacity — refreshed by 7am with deltas vs last cycle.
Step 2
Agents draft the weekly narrative. Trends come explained.
Lead time crept 12% — traced to which queue, which week, which team. Deploy frequency dropped — tied to the incident or the freeze. The numbers come with the story already drafted.
Step 3
Your engineering lead reviews and approves the readout.
One weekly view: numbers, movers, narrative. Edit a line, confirm the rest, it publishes for the leadership readout. No more 6am Monday drafting before the staff meeting.
Where the line sits.
Agents run the repetitive work your VP Engineering / Head of Platform shouldn’t be doing. You stay in charge of the judgment.
Specifically, agents don't:
- Publish team-level metrics or rankings without your VP Engineering's approval.
- Attribute a velocity drop to a specific engineer without supporting evidence.
- Share engineering metrics outside your reporting line without your sign-off.
A human approves anything that changes your books, your customers, your compliance posture, or your people. Every time.
YOUR DATA STAYS YOURS.
Agents read what they need to do the work. Nothing is stored on our side. Nothing is used to train models.
PRODUCTION-READY ON DAY ONE.
Every deployment includes governance and approval chains, role-based access control, monitoring, and model management.
Ready to pressure-test it?
Talk to an agent or drop a note. We'll come back with a proposal.
FAQ
Frequently Asked Questions
Yes. Kickoff captures your definitions — what counts as a deploy, how lead time is measured, where you draw the cycle. Agents use your rules, not industry defaults.
Every metric traces to its source query. Wrong numbers get caught in your sales lead’s review before the readout. Fix is minutes, not a Slack thread.
No. We sit on top — pulling from whichever tool you already use (or directly from GitHub + your tracker). Your existing platform keeps the data; agents do the narrative.
Three deployment options: our compliant environment, your cloud, or on-prem. Data stays in the perimeter you pick. Agents read inline to do the work — nothing copied, stored, or used to train models.
Let's look at your workflow together.
Talk it through with an operator now, or send a note. Tell us what's eating your week — we're here to take routine work off your team's plate so they move faster on what matters.

LIVE · TALK OR TYPE
Talk it through with your operator.
A few minutes with the operator who knows this kind of work. Tell them what's slowing you down; if it's a fit, we'll line up a human follow-up to take it further.
Talk or type — your choice. No phone number needed.
ASYNC · 1 BUSINESS DAY REPLY
Or send us your workflow.
Tell us what eats your week. We read every one and reply within a business day.